The following 2 drawings were created with QuantumGIS; vector layers were obtained through the Federal Web site GeoGratis.
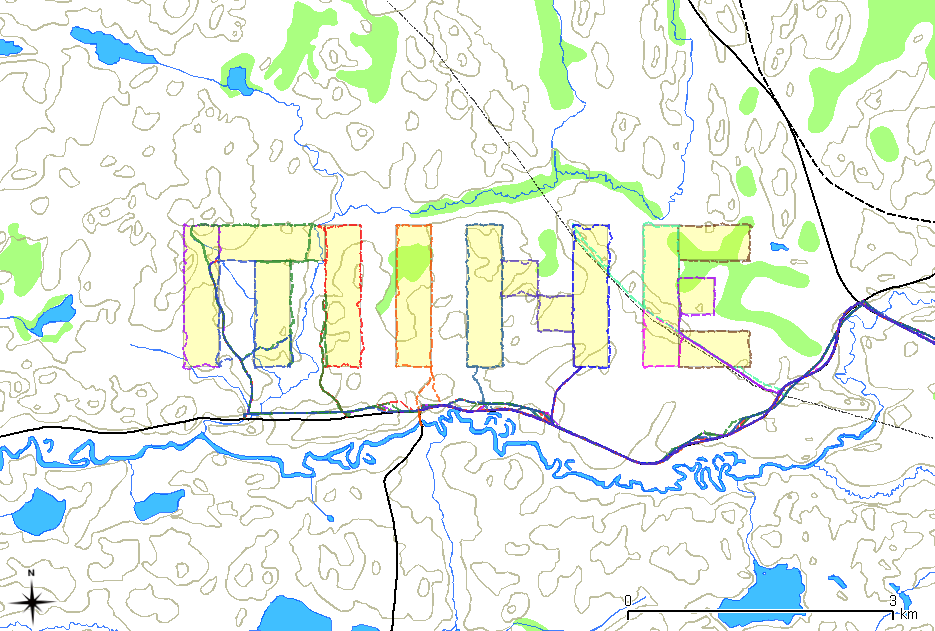
This first image shows the GPS tracks from blazing out borders of the claims.
The different colours of the tracks represent a single day of staking.
A total of 12 days was required to stake all of the claims. Click image for larger view.
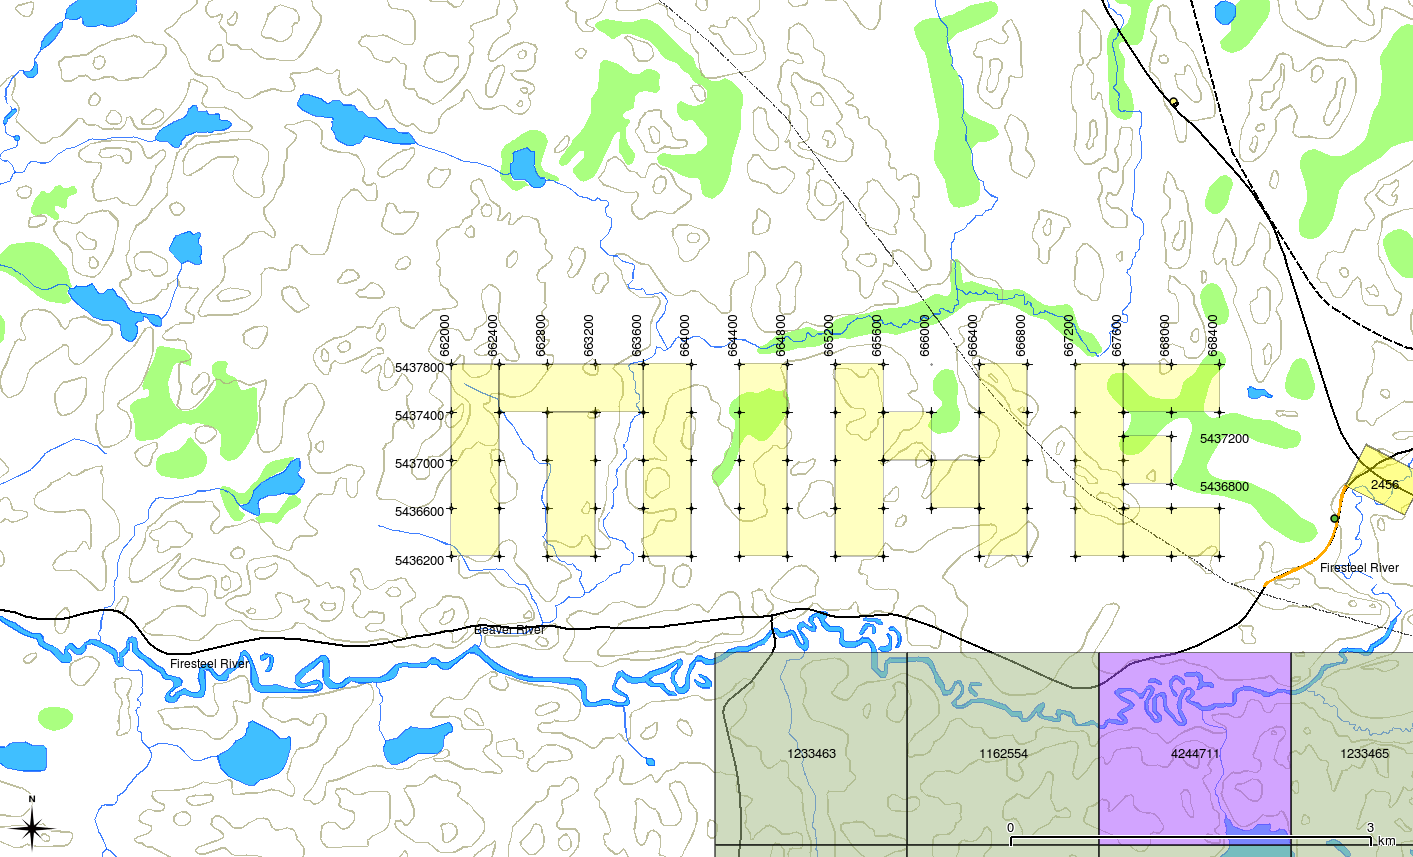
This second map displays the NAD83 UTM zone 15 grid.
All units are in metres.
Each crosshair is the location of either a corner post or a line post. Click image for larger view.
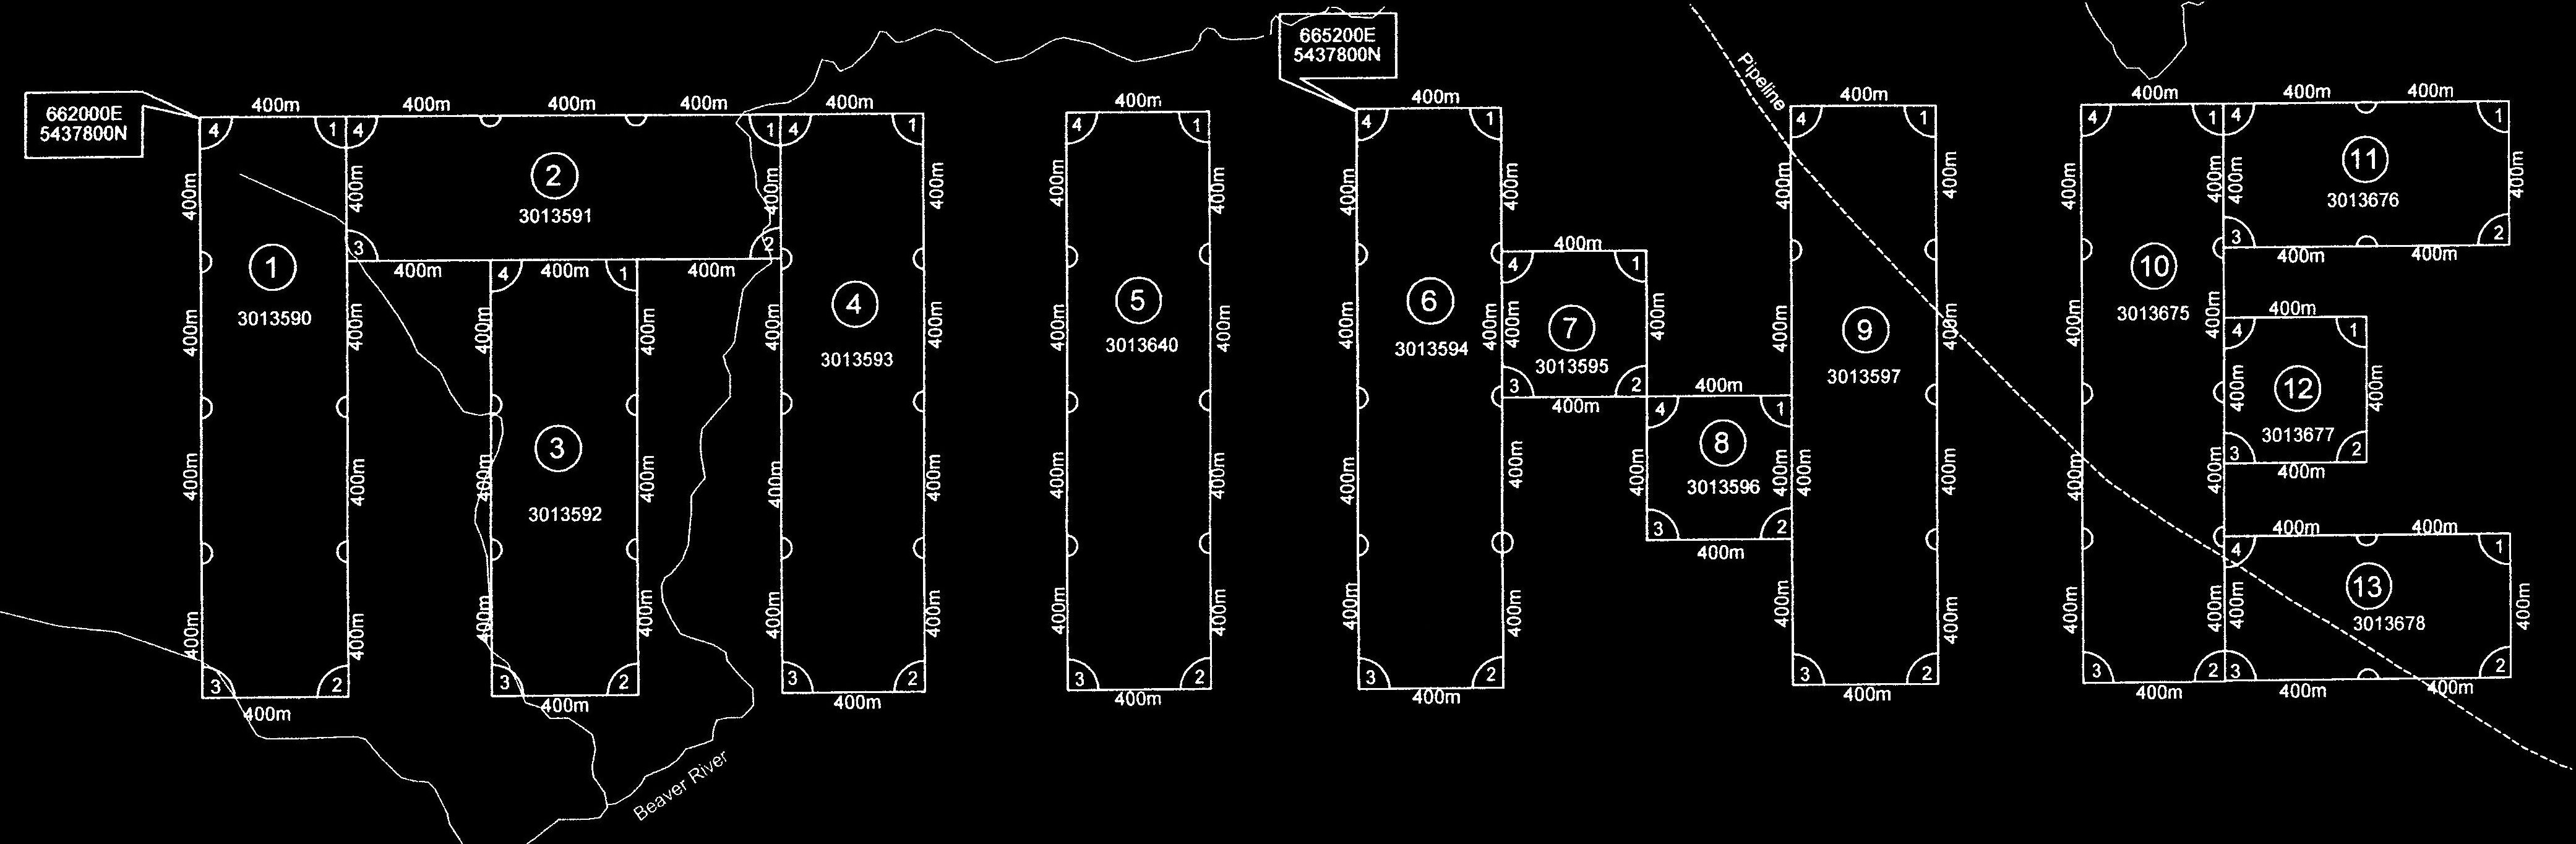
This is a copy of the Drawing Mr. X made for the application using AutoCAD. The colours have been inverted with the Gimp.
Click image for an extremely large view.
Click to view a
Google Map